How to debug memory usage of a JVM-based application
What do you do when your JVM-based application gets OOM killed or exhibits wild memory usage pattern? In this blog post, I will explore some tools and concepts we can use to start debugging this problem.
Background
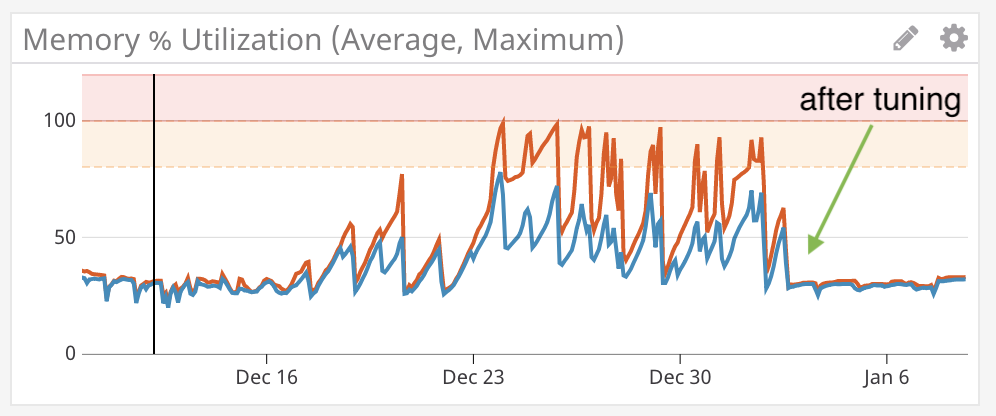
My team at Deliveroo, Growth Marketing Engineering, recently launched a new service written in Scala. It is a GraphQL server built with Sangria on top of Akka HTTP, containerised with Docker and deployed on Amazon Web Services as an ECS Service. In other words, it follows a pretty standard setup in today’s cloud-based environment. However, after launch, the service exhibited an extremely unstable memory usage pattern as seen in the screenshot below:
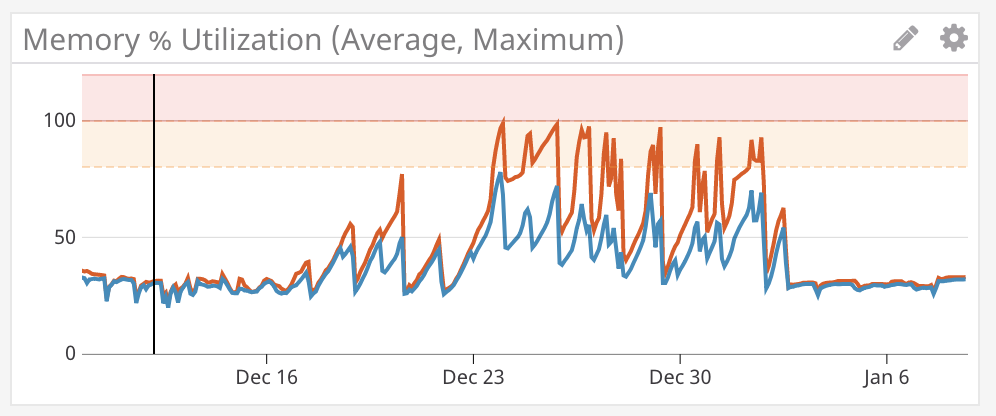
The blue line indicates the avarge memory utilisation across all containers, while the red one indicates the maximum memory utilisation at any given moment. After a container maxes out its memory allocation, ECS kills it with an OutOfMemory error message and replaces it with a new container, causing in-flight requests to be dropped and temporarily increasing the service’s latency. Not an ideal situation for a new service to be in!
Understand the service’s runtime environment
Before diving into memory analysis, the first thing we need to do is understanding the service’s runtime environment. Our Scala service runs on a JVM inside a Docker container, meaning that there are two level of memory constraints involved. The first level of memory constraint is specified by a number of JVM settings, most notably:
-
-Xms: specifies the initial memory allocation pool -
-Xmx: specifies the maximum size (in bytes) of the memory allocation pool
So suppose if we launch our application with -Xmx2G, the JVM will think that it has a maximum of 2 gigabytes of memory to use. Whether this is indeed the amount of memory available in reality depends on the second level of memory constraint, which is specified by our Docker configuration. Since we launch our service with ECS, this is specified as an ECS Task Definition parameter. In our example, if we specify a hard memory limit of 1G for the container to use but the JVM inside the container thinks it has 2G, we will see out-of-memory crashes even without any memory leak.
A safe way to align these memory constraints is to set a memory limit on the Docker container and let the JVM work out how much memory is available automatically. We have to not specify an -Xmx value and turn on a couple of settings for the JVM, namely -XX:+UnlockExperimentalVMOptions -XX:+UseCGroupMemoryLimitForHeap. These settings ensure that the JVM will use the amount of memory available to Docker for its automatic calculation. Otherwise, it will use the amount of memory available in the underlying host machine, which can be misleading. For more information, check out this blog post by RedHat.
After -Xmx is taken care of, we can tune -Xms by profiling our application and pick an appropriate value. More on how to do this later. Note that to determine which settings the JVM was launched with, we can use the flag -XshowSettings:vm when launching the application. To determine these values of an already running JVM, we can use tools like jcmd.
Visualise JVM performance metrics with VisualVM
After understanding the runtime environment and making sure that our memory configuration is sensible, we can then try to visualise JVM performance metrics under different conditions (idle, low traffic, short burst, etc.) to establish some baseline for our analysis. VisualVM is a great tool for this job. It integrates a bunch of JDK command line tools with some lightweight profiling capabilities and provides a great UI on top for exploration.
For this example, consider the following Scala program:
package engineering.deliveroo

class Item(key: String)

object MemoryDebugDemo extends App {
  override def main(args: Array[String]): Unit = {
    val map = System.getProperties
    var i = 0

    while (true) {
      map.put(new Item("key"), "value")
      i += 1
      if (i % 1000 == 0) {
        println(map.size)
        Thread.sleep(1000)
      }
    }
  }
}
It’s a simple application that continuously adds an Item object as a key into a map. On every 1000th iteration, it will print out the size of the map and sleep for 1 second. For other interesting approaches to artificially create a memory problem, see this Stackoverflow post.
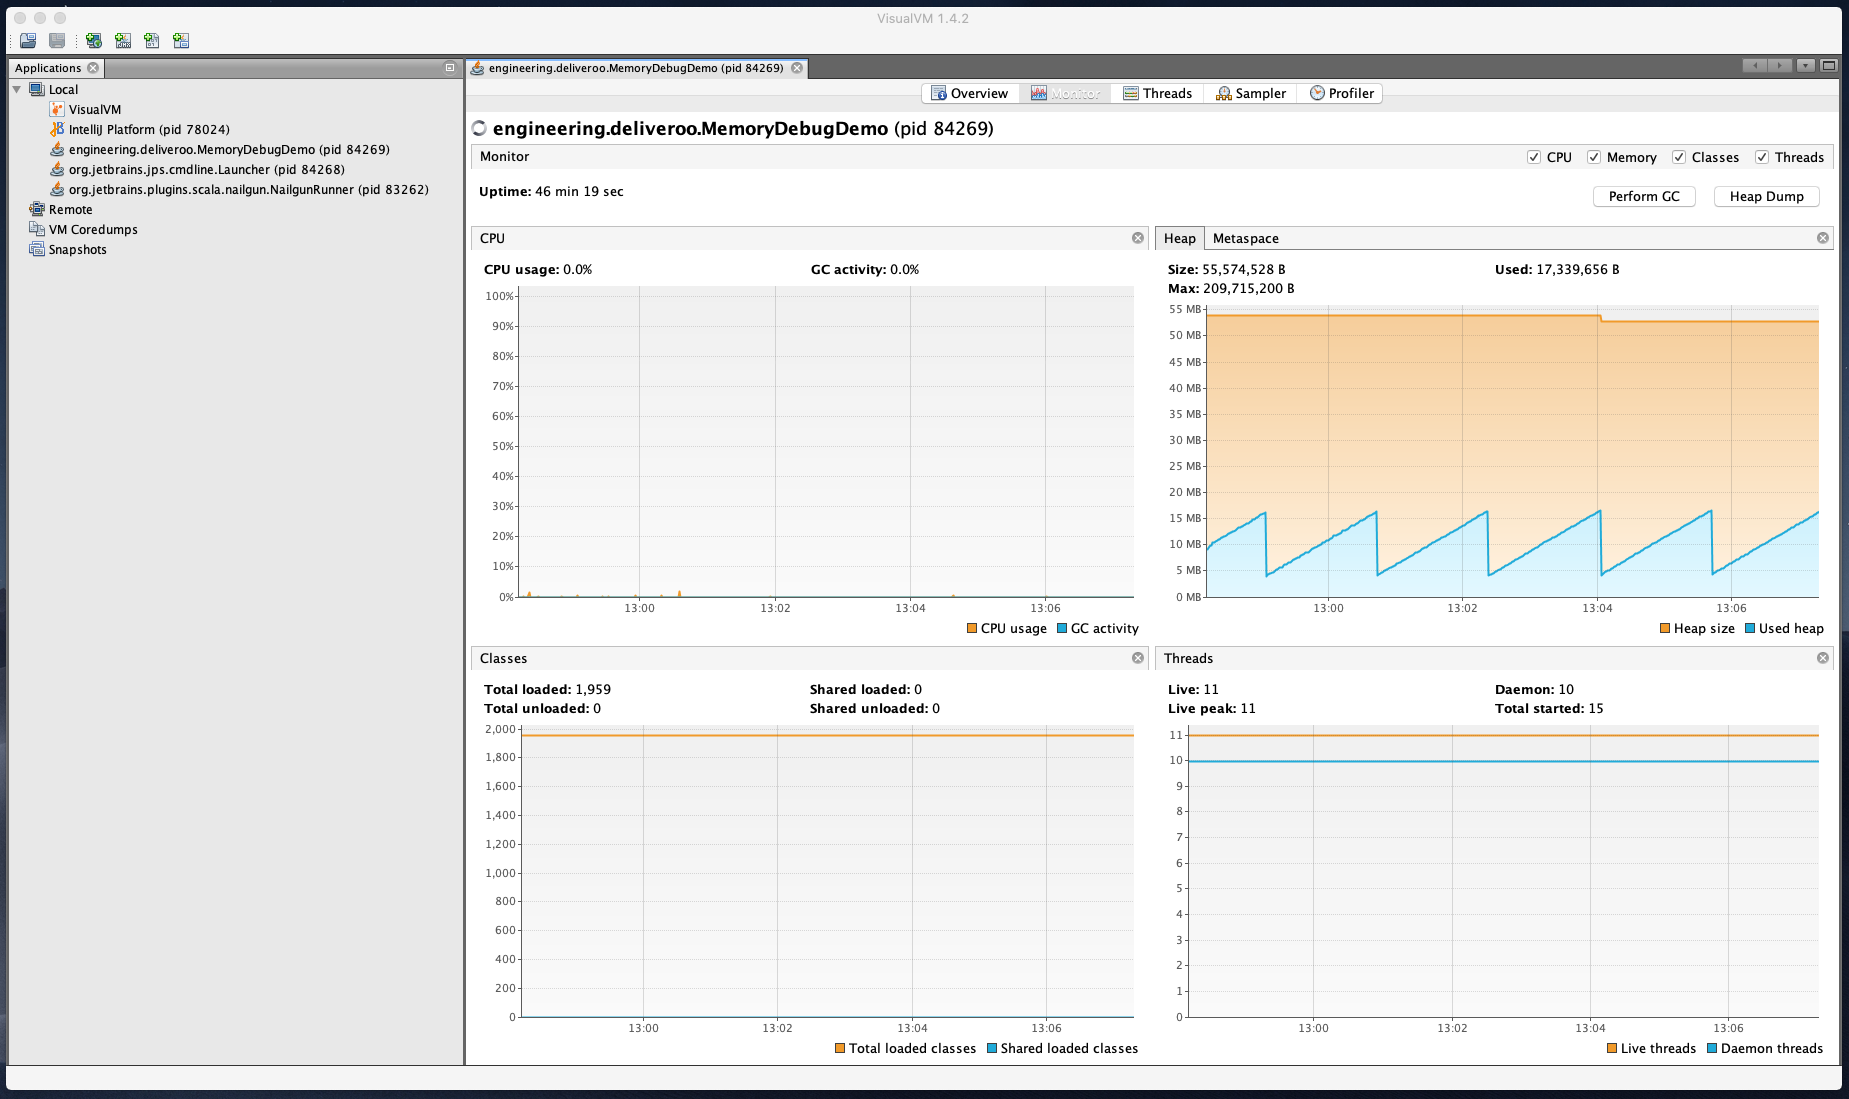
After we run our application, Visualvm will automatically detect the running JVM process and graph its performance metrics:
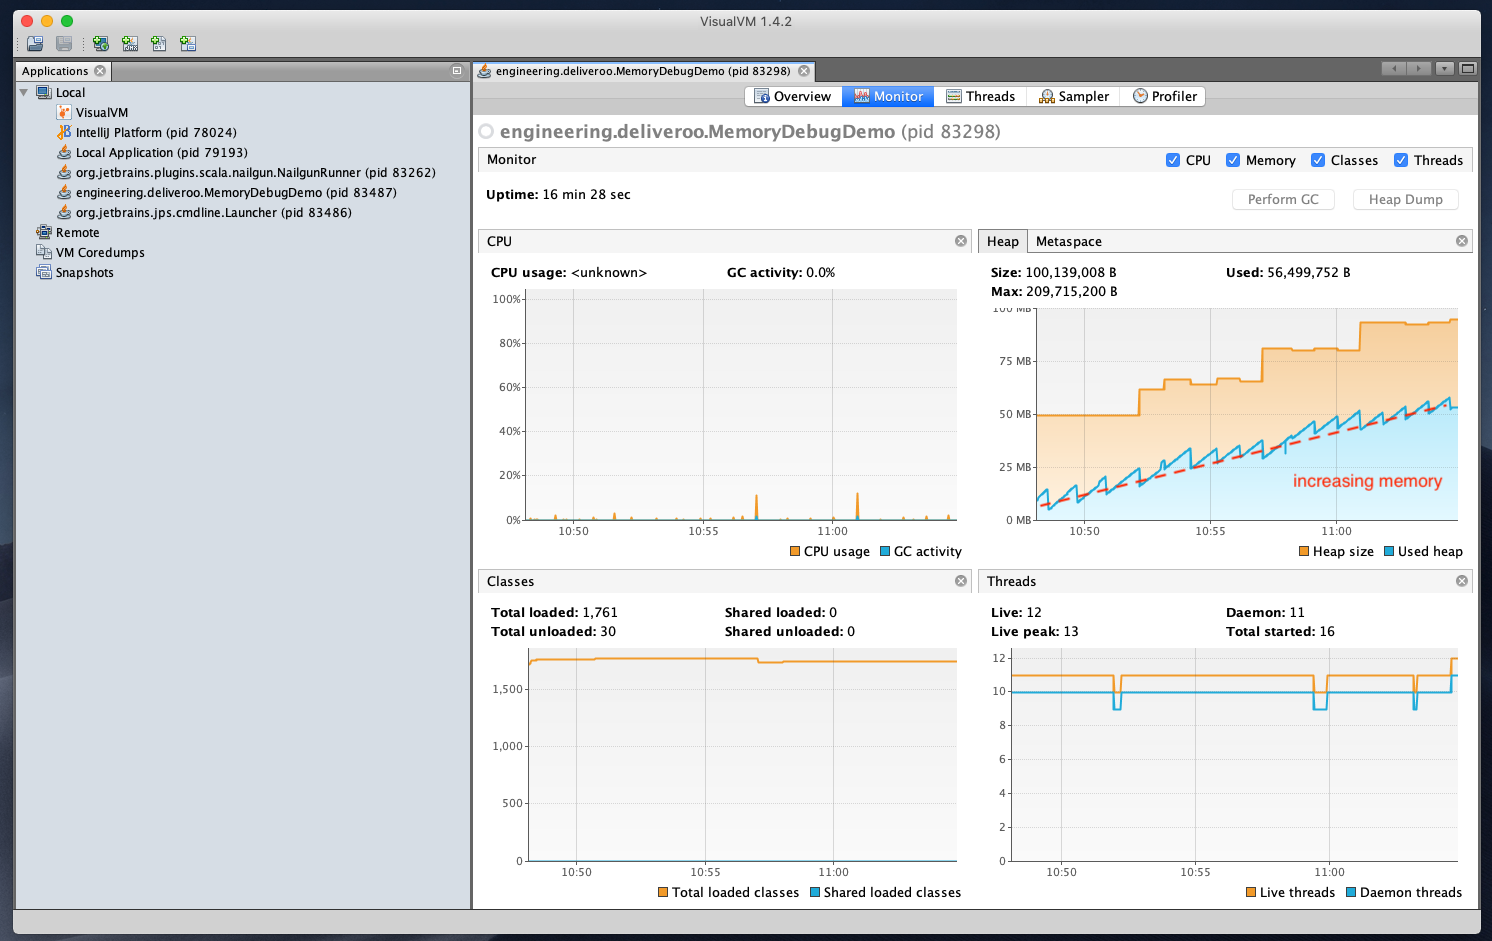
Neat! As you may notice, after each Garbage Collection cycle (each tooth in the saw-tooth pattern), the baseline of the memory footprint keeps increasing until it reaches the maximum amount allocated. Furthermore, the size of the map keeps increasing, as seen in the output, even though we keep adding the key of the same “value” to the map. This indicates a potential memory problem.
Note: we avoid using the phrase memory leak here. Some might argue that it is a memory exhaustion by not cleaning up unused references, but not a true memory leak.
Analyse JVM memory snapshot with VisualVM
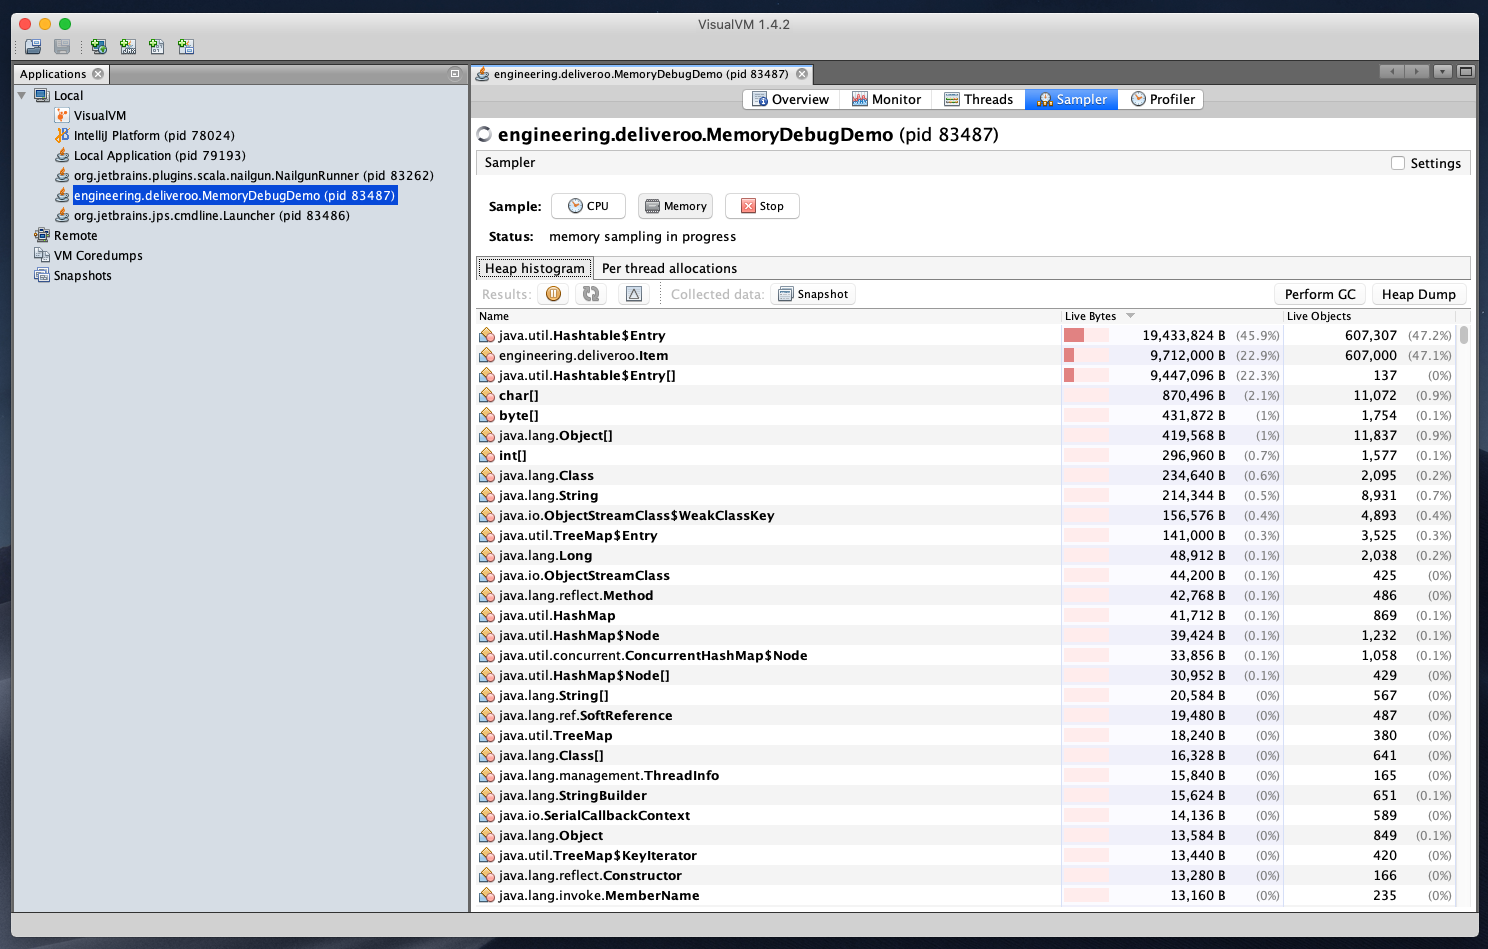
After noticing a potential memory problem, what we can do next is to look at the Sampler tab in VisualVM to see what’s using up all the memory. In our case, it should be pretty obvious that we have an ever-expanding Hashtable and our Item objects keep getting created without ever being cleaned up:
Another interesting method we can use to identify memory problem is to compare two (or more) memory snapshots of the JVM and see if we can detect any trend:
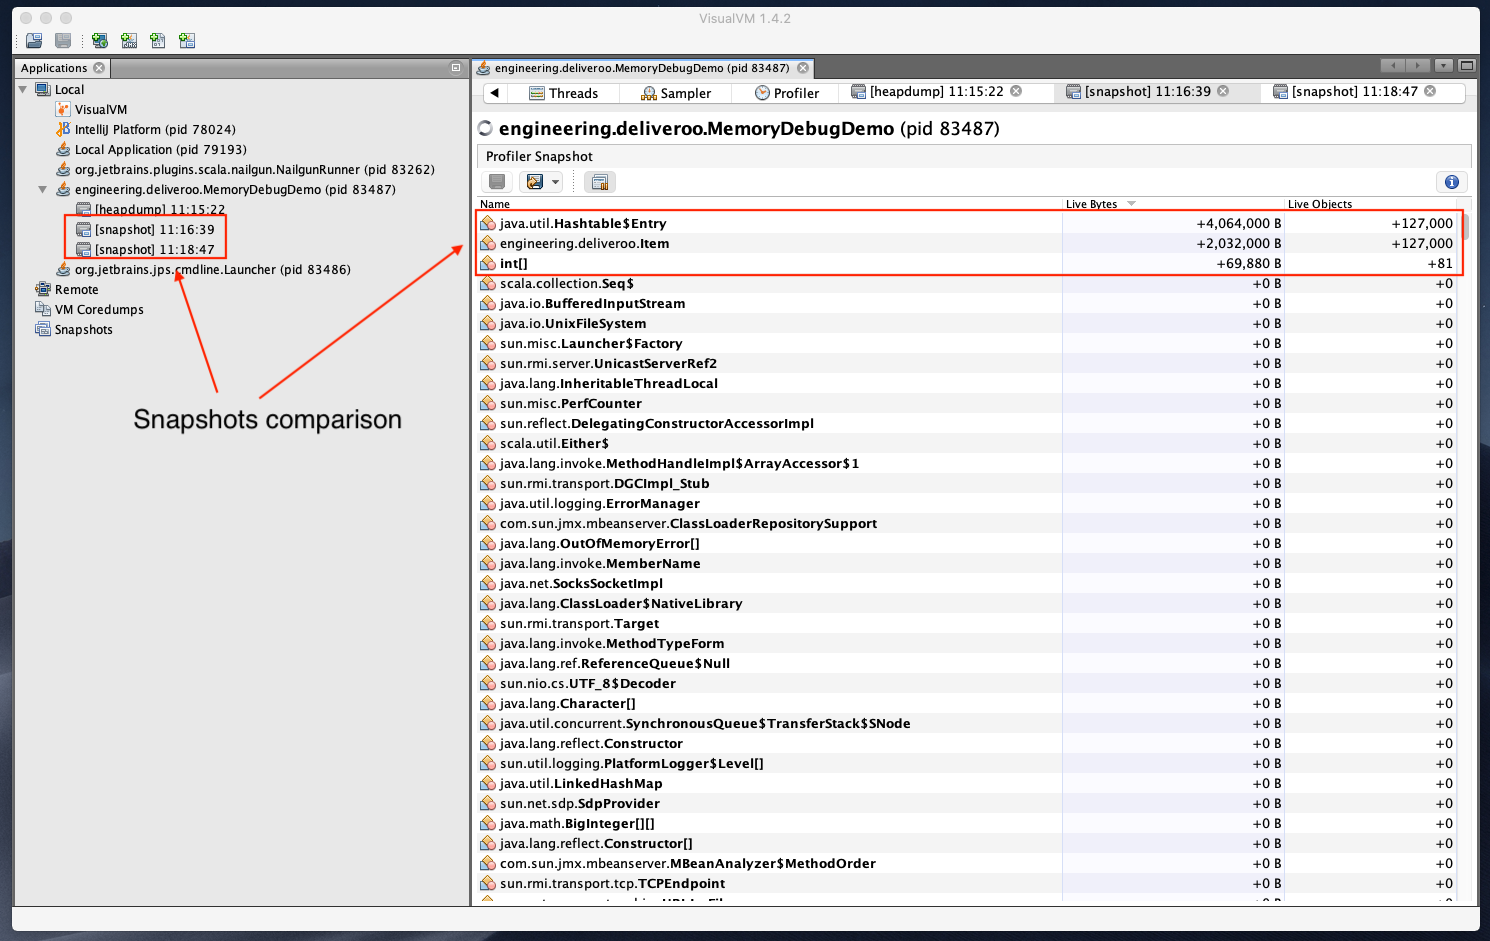
Comparing two memory snapshots for our application reveals that indeed the memory allocation for Hashtable and Item increases while other objects get garbage collected correctly (0B changes between 2 snapshots). We should be careful to take snapshots at the correct moment in two different GC cycles. Otherwise, it might not be a fair comparison.
Analyse JVM memory heap dump with MAT
Sometimes in more complex applications, it’s not that obvious what causes the memory problem when looking at the Sampler. In these cases, it’s also beneficial to perform an analysis on the heap dump. You can obtain a heap dump from the JVM just by clicking the Heap Dump button in the Monitor tab of VisualVM. Or in situations where you can’t use VisualVM, command line JDK tools such as jmap or the previously mentioned jcmd accomplish the same thing. Last but not least, you can use JVM built-in settings -XX:+HeapDumpOnOutOfMemoryError -XX:HeapDumpPath=/path/to/heapdump.bin to generate a heap dump whenever an OutOfMemoryError occurs. This is super useful in production environment when you don’t really know when a memory problem will happen.
Once you have generated a heap dump, the next step is to open and analyse it. A popular tool for this job is the Eclipse Memory Analyzer (MAT). The tool has a built-in functionality to detect memory leak suspects automatically:
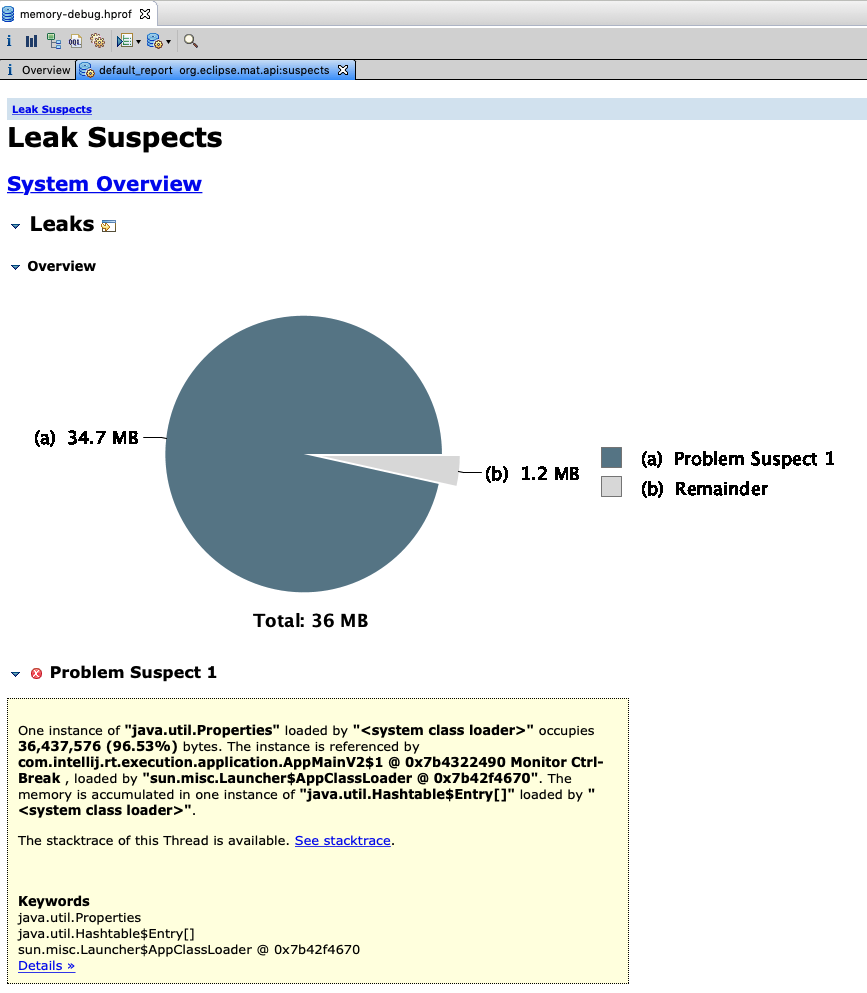
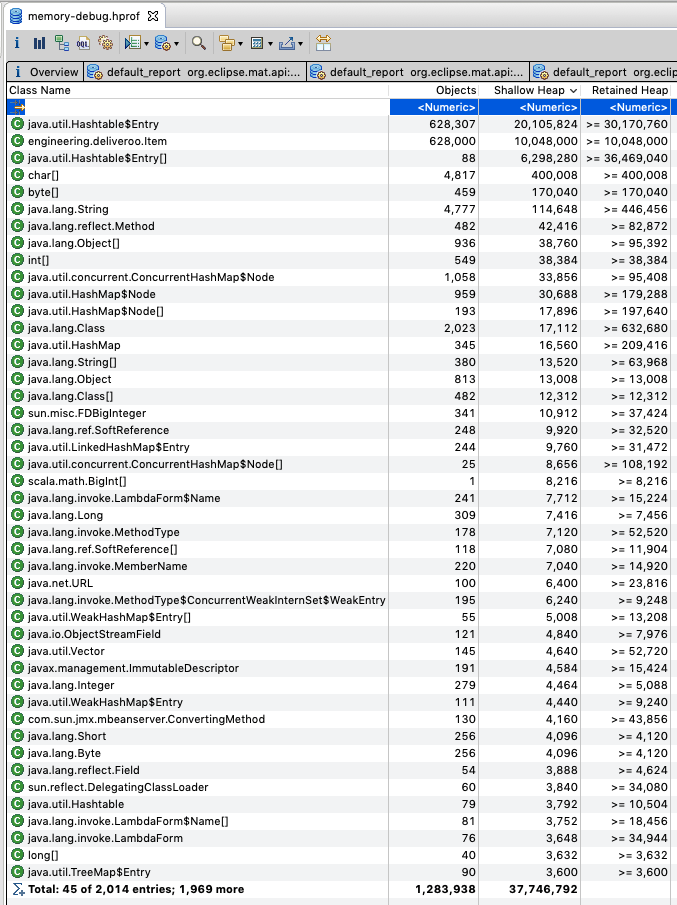
MAT correctly identifies java.utils.Properties as a memory leak suspect. You can also play around with tools built into MAT like Histogram of objects to determine what objects are the most memory intensive:
Fix the root cause
So after identifying the memory issue and potential suspects, our last task is to find and fix the root cause. In our example, the root cause is fairly obvious: there is an ever-increasing Hashtable even though we keep adding key (Item object) with the same value for its only attribute. This suggests that the keys are not being compared using its attribute. There is a great article here about how to effectively do this so we can use object as keys in hash-based collection. In a nutshell, we have to override equals and hashCode method in our Item class. Luckily for us, since we use Scala, we can simply change class Item to case class Item to achieve the same effect. The Scala compiler automatically generates a natural definition of equals and hashCode for a case class.
After changing class Item to case class Item, we can launch the application again and visualise its performance metrics with Visualvm. As you could see, the baseline of its memory footprint stays flat and the size of the map in the output stays fairly constant:
Final thoughts
Going back to our service in production, after performing all of this analysis, coupled with load testing using JMeter, we were fairly certain that there was no memory leaks in our program. This insight motivated us to go back to basics and try to understand our runtime environment. As it turned out, the root cause of our problem was an unreasonably big -Xms value and an -Xmx exceeding the container’s memory limit. Tuning these values completely resolves our issue:
About Lim Hoang

I am a backend engineer working with the Growth team at Deliveroo. I like working with all sorts of technologies and (programming) languages. In my free time, I try to do standup comedy and learn (human) languages. I’m @limdauto pretty much everywhere on the Internet.