Profiling Rails Applications with Flamegraphs 🔥
How we used Flame Graphs to profile our Rails backend code in our development environment and thus fixed slow, suboptimal code faster.
The Context
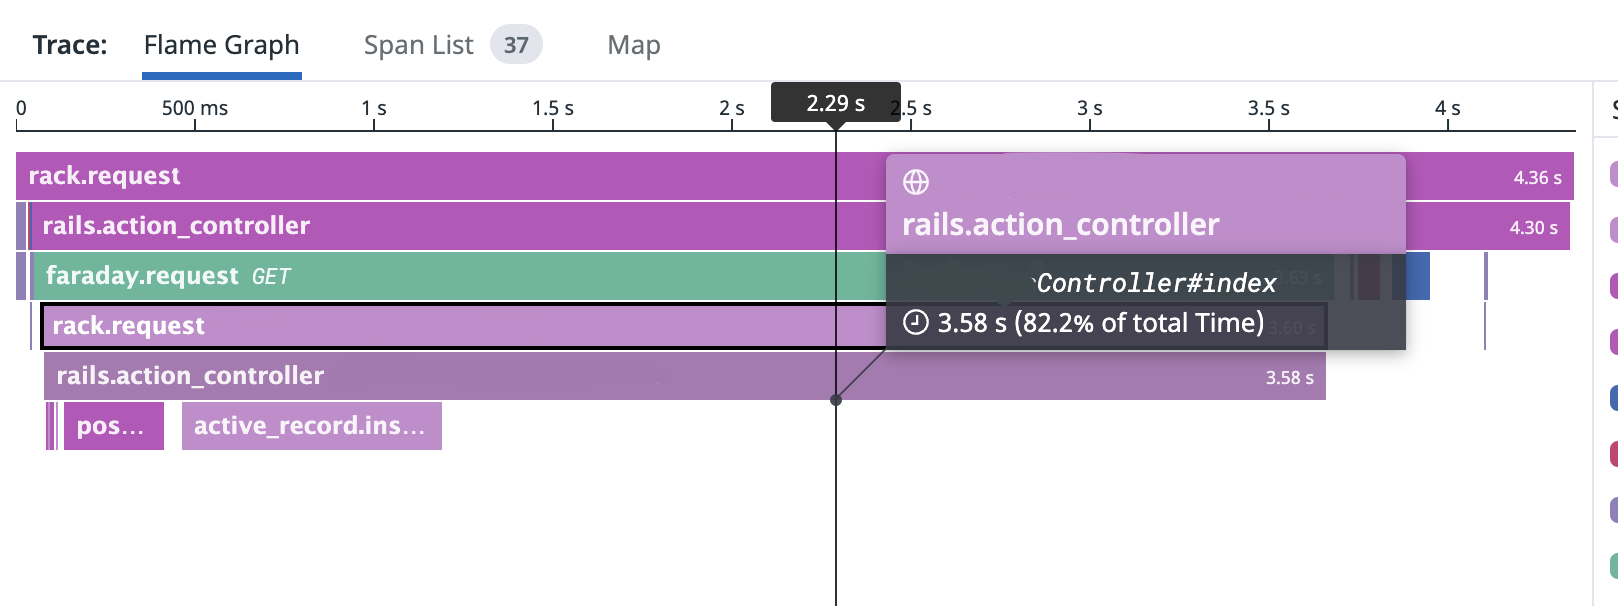
As part of our 2022 Q4 readiness goals, we were working on optimising one of our endpoints which had started spiking in latency and consequently leading to response times of > 4 seconds.
This increased latency resulted in the real world impact of our riders intermittently receiving 503 errors when they wanted to switch zones in Deliveroo’s rider app.

503 errors in the Rider API due to a slow Rails API
Our initial investigations did not point to any obvious bottlenecks, such as the database or the EC2 instance slowing down due to increased traffic, etc.
Neither was the data being queried via the API too large and nor was the code in question new. (It was untouched for the past 5 years).
For some reason the response time for this API was quite big and a large chunk of time spent was in Rails.
 Datadog narrowed down the problem to time spent in the Rails App
Thus, there was a need to further isolate different bits of the code to see where the problem lay. Thankfully Datadog had a neat little feature which helped - Spans.
We deployed our code with a few Datadog spans and narrowed the issue down to the below piece of non-performant code.
serializer = CollectionSerializer.new(collection, index_params, resource_name: :zone)
output = serializer.serializable_hash
render json: output
Datadog was unable to provide more fine tuned insights. It only helped us conclude that most of the time was spent in this call : serializer.serializable_hash.
That serialiser in question was responsible for packaging our object in a HATEOS compatible hash.
 Adding Datadog spans in the code and deploying them helped, but it was a slow process
Since adding further Datadog spans was a slow and frictional process, we resorted to Flame Graphs and local Rspec testing to recreate and isolate the problem.
The Problem
We wanted a quick way to stress test a piece of Rails application code in our local development environment and get feedback on our improvements without relying on production code changes, deployments or Datadog.
The Solution
ruby-prof-flamegraph - A ruby gem which helps analyse bottlenecks in our code and helps generate an easy to use Flamegraph.
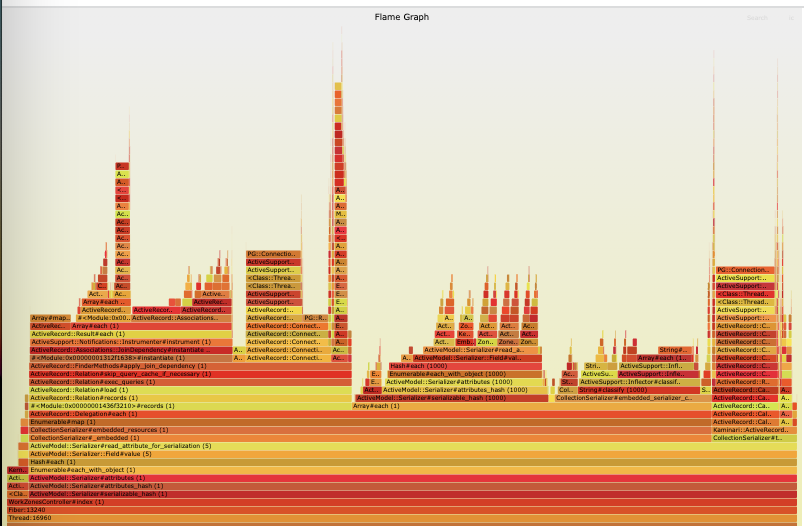
 The Flamegraph generated by ruby-prof-flamegraph
Usage :
Simply add the gem to your Gemfile
group :development do
  gem 'ruby-prof-flamegraph'
end
Wrap the code you want to analyse in this block below
profile = RubyProf.profile do
  hash = collection1.serializable_hash
end
The block generates a fold stack file which can be fed into Flamegraph to generate an interactive SVG file to visualise the graph.
File.open("stack-file", "w+") do |file|
  RubyProf::FlameGraphPrinter.new(profile).print(file)
end
Using Flamegraph to generate the SVG graph
cat stack-file | ~/GitHub/FlameGraph/flamegraph.pl --countname=ms --width=1600 > flame-graph-testing.svg
The Impact
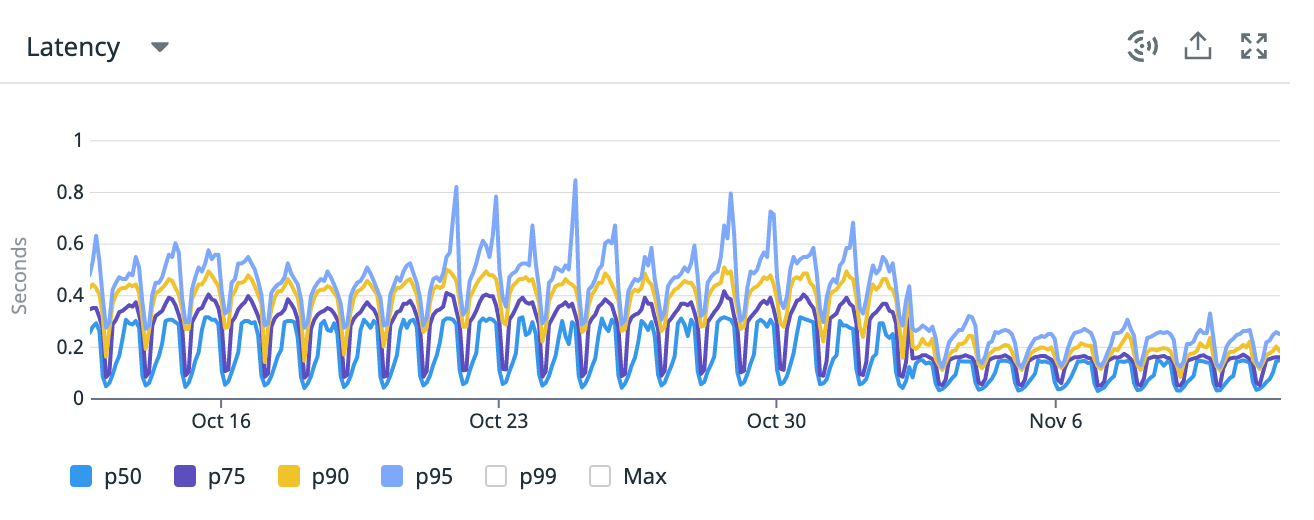
The flame graph analysis helped us conclude that our serialiser was spending too much time initialising redundant objects. We removed the generation of redundant objects and achieved a 60% reduction in latency.
Even though the data being queried and packaged into the hash was < 1000 records, the process of packaging was not optimal and led to the initialisation of an exponential number of objects which caused the slowdown.

A visible reduction of latency could be seen since the fix was deployed, thanks to quick Flame Graph profiling