Roonomics: How Economics Helped Us to Build a Churn Prediction Model
Firat, Data Scientist, recounts his experience in building a machine learning model to predict restaurant churn. He highlights how his knowledge of Economics has guided his thinking and helped him to make some key decisions in the building stage.
Why churn prediction matters
We partner with thousands of restaurants across our markets to bring our customers an unbeatable selection of food and cuisines. We work hard to find and onboard new restaurants to our platform to improve the customer choice and experience. However, onboarding efforts would be wasted if existing partners were to leave, an event we refer to as churn.
We expect there to be some natural level of churn. A restaurant might see low demand because of an adverse economic environment, or the restaurant might be too busy serving on-site customers. Or perhaps the restaurant owner is simply closing shop due to relocation etc.
Sometimes though we can prevent a restaurant from churning simply by checking in and finding out what is not working for them. We might resolve a technical issue or work hand-in-hand with the restaurant to refine their offering and optimize their performance on our platform. On other occasions, preventing churn isn’t quite so simple – this is where the need to quantify churn risk comes in.
The ‘prevention is better than cure’ principle applies here: It is easier to fix a problem encountered by a restaurant early on, rather than waiting until it churns. Fortunately restaurant data can give us early warning signs about churn risk.
Why we needed to change our approach to churn prediction
Deliveroo previously utilised a model that flagged potential churn by monitoring certain performance stats in restaurant data. This approach offered high interpretability, as the reasons for a restaurant being flagged were always transparent. The flags were established by analysing metrics that showed the most significant variance between active partners and those that had eventually churned.
This model was designed to catch most at-risk restaurants, leading to some unintended consequences. Churn is a fairly rare event in the restaurant population, so a ‘making sure to catch all’ approach resulted in also flagging many restaurants which were not really at risk. In technical parlance, high precision was sacrificed for high recall.
We can think of situations where this is the right approach to take, for example, predicting attempted financial fraud (better to be a bit too cautious than a bit too lax) but the economics of Deliveroo’s context favour the opposite approach. Our account management and retention team’s capacity to deal with flagged restaurants is limited, so raising more flags than we could reasonably deal with did not make sense. In fact, it was bad economics, because the benefit of trying to prevent a not-at-risk restaurant from churning is zero, but the (opportunity) cost is not reaching out to a restaurant which is at risk.
How we built a superior prediction model
We returned to the drawing board to design a new churn prediction model that a) satisfies time constraints of our colleagues, and b) identifies restaurants with the highest churn risk. Our solution ranks restaurants in terms of their churn probability and then labels all restaurants above an (adjustable) churn probability as at risk. By construction, every such labelled restaurant has a higher chance of churning than any non-labelled restaurant.
So far, this is a fairly standard machine learning / classification problem. But we also needed to be mindful of a few requirements specific to the business problem at hand:
- We were trying to forecast churn, so we had to be careful about data leakage when choosing model hyperparameters. We therefore evaluated each hyperparameter configuration using rolling-window cross-validation, ensuring that the model was always trained on historical data and validated on a later period.
- Churn is a rare event, so we had to choose an appropriate score for model optimisation (as alluded to above, precision took precedence over recall).
- To prioritize restaurants based on business need, we developed an approach that considers both the likelihood of a restaurant becoming at risk and its broader importance to Deliveroo.
We also wanted to retain some level of interpretability without sacrificing model accuracy, so in addition to churn probabilities we also computed Shapley values to find the feature which most contributed to the estimated churn probability.
The rest is computation.
Productionising this was a bit of a learning curve for yours truly (who was an academic economist once), but he got there eventually. The model is currently in its testing phase, running on a weekly schedule as an Argo pipeline and surfacing the results with accompanying useful information for end users.
Did we achieve our objectives?
During offline testing, we saw:
- A reduction in the number of flagged restaurants by more than 90%. This aligns the at risk flag rate with both actual churn rates and our capacity to intervene and thus prevent churn.
- Precision was boosted 8x. Thus, we can be confident that our outreach is actually addressing a real churn risk.
Recall suffered. So we should bank this as a cost - or should we? Not if we think through the economics of this problem. True, more of the at-risk restaurants were being flagged by the previous model, but the pool of flagged restaurants had also many more false positives. We couldn’t action all of them anyway, and if you randomly picked one of the flagged restaurants, chances were that it wasn’t truly at risk of churning.
Eventually, the proof of the pudding is in the eating: does the model in fact help reduce restaurant churn? This we will determine in a currently running (as of this writing) experiment: We randomly assign flagged restaurants to treatment or control. Only the former are made visible in the form of churn alerts to Deliveroo’s retention team and restaurant account managers. Our hypothesis is that the churn rate of treated restaurants will be lower than that of control restaurants.
Is the churn model accurate?
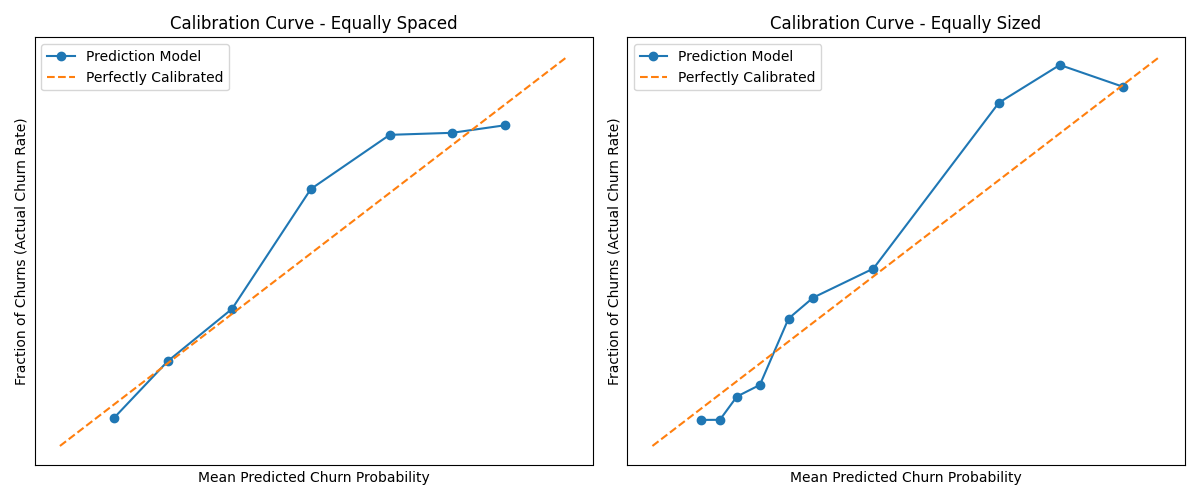
There is more nuance to the question than it first lets on, but we will go here with a confident YES. The model we’ve built is able to discriminate between restaurants which are more or less likely to churn. But that would be a low bar. In aggregate, the model is even quite accurate in its estimated probabilities. The figure below shows some calibration curves (real churn probabilities plotted against predicted churn probabilities). Restaurants have been grouped into bins. The left sub-figure groups restaurants into equally wide prediction intervals. Since most restaurants have very small churn probabilities, the right sub-figure groups restaurants such that each group has the same number of restaurants. Both figures move around the 45-degree line. So far, so good.
Is the churn model useful?
The trouble is, if churn is really rare (say, if 1% of restaurants churn) then even a restaurant with a relatively high churn probability (say, 5%) is not that likely to churn. Is it worth doing something about this? Again, economics catches up with us: there is a certain cost in terms of time, but only an uncertain gain since the restaurant might or might not churn if we do nothing. These metrics then guide our actions.
The prediction model tells us the probability that a restaurant will churn. It doesn’t tell us how much we can reduce this probability by taking appropriate action, or indeed, what an appropriate action should look like. But churn / no churn is the only thing that we observe a priori, and thus the only thing our prediction model can quantify.
To make it useful - not just for prediction, but for reducing churn - more stars have to align: 1) the model needs to be accurate, but in addition 2) the restaurants need to be actionable (their churn is preventable), and 3) the right actions need to be taken. The experiment described above tests for this combined pipeline: Do churn rates go down or not? We can also test the model accuracy separately on our control group of restaurants by checking real churn rates against predicted churn probabilities (as in the calibration curves above). The question of actionability (2 and 3) is a more knotty problem and would need more experimentation to isolate.
Experimentation is something we do plenty of at Deliveroo. You can find out more about our experimentation approach in another post written by the Deliveroo team.
About Firat Yaman

I’m a Data Scientist (and Economist) in the Merchants Team at Deliveroo, where I mostly work on statistical and econometric problems like prediction and causal inference. Before joining Deliveroo, I worked as an economist in academia and in economic regulation. I spend much of my free time reading, listening to podcasts, and entertaining my son (and myself).